The cloud
AWS is the world’s most comprehensive and broadly adopted cloud offering, with millions of global users depending on it every day. To build a sustainable business for our customers and for the world we all share, we’re designing data centers that provide the efficient, resilient service our customers expect while minimizing our environmental footprint—and theirs.

Our approach
Increasing efficiency
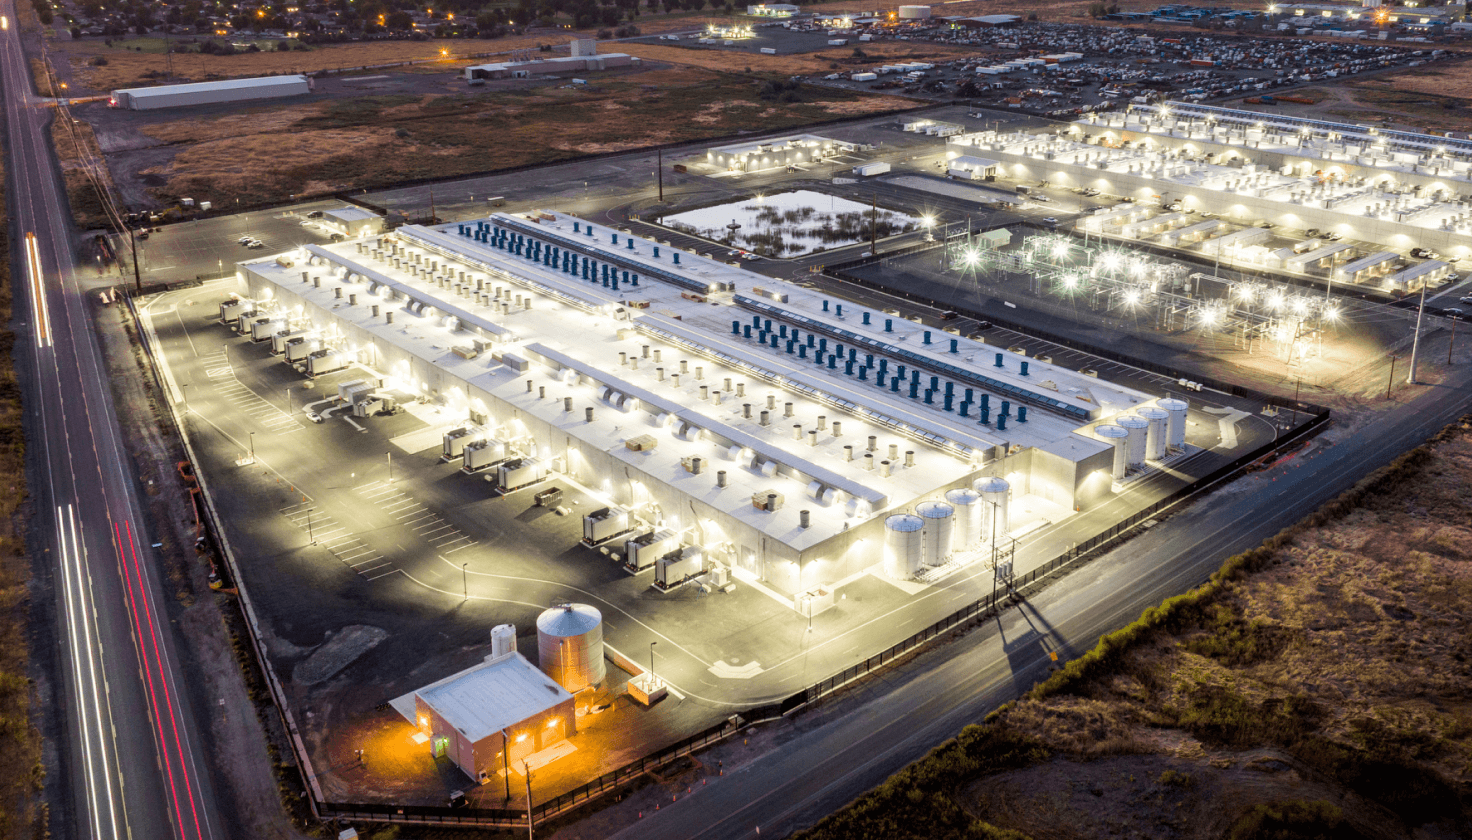



Power usage effectiveness
AWS has provided cloud services to customers for nearly 18 years, and continues to innovate to increase efficiency with each generation of our data center designs. As AWS builds new data centers, we seek the optimal balance between energy and water use. The new data center components in AWS data center design are projected to reduce mechanical energy consumption by up to 46%, reduce embodied carbon in the concrete used by 35%, and deliver a power usage effectiveness (PUE) rating to 1.08. PUE is one way we measure the efficiency of our data center operations. A lower PUE indicates a more efficient data center and a PUE score of 1.0 is perfect. AWS calculates PUE using the internationally-recognized principles of the International Organization for Standardization in line with our PUE Methodology.
In 2023, AWS data centers had a global PUE of 1.15, and our best performing site was in Europe with a PUE of 1.04. In the Americas, our best performing site has a PUE of 1.05, and in Asia Pacific it is 1.08. Both ratings are below the IDC estimated PUE of 1.84 in 2023 for on-premises data centers.
All regions PUE
The following data includes average PUE ratings between January 1 and December 31 of each year. Data is not available (—) where AWS operated data centers less than 12 months.
AWS Geo PUE
| Geography | PUE 2022 | PUE 2023 |
|---|---|---|
| Global | 1.15 | 1.153 |
| AMER | 1.15 | 1.14 |
| EMEA | 1.12 | 1.12 |
| APAC | 1.27 | 1.28 |
AWS Region PUE
| AWS Region | PUE 2022 | PUE 2023 |
|---|---|---|
| Europe (Stockholm) | 1.12 | 1.12 |
| Middle East (Bahrain) | 1.38 | 1.32 |
| Asia-Pacific (Mumbai) | 1.43 | 1.44 |
| Asia-Pacific (Jakarta) | 1.39 | 1.35 |
| U.S. East (Ohio) | 1.12 | 1.12 |
| Africa (Cape Town) | 1.36 | 1.24 |
| Europe (Ireland) | 1.10 | 1.10 |
| Middle East (UAE) | -- | 1.36 |
| Europe (Frankfurt) | 1.32 | 1.33 |
| South America (Sao Paulo) | -- | 1.18 |
| Asia-Pacific (Hyderabad) | -- | 1.50 |
| U.S. East (Northern Virginia) | 1.16 | 1.15 |
| Asia-Pacific (Melbourne) | -- | 1.08 |
| Asia-Pacific (Tokyo) | 1.30 | 1.32 |
| U.S. West (Oregon) | 1.13 | 1.13 |
| U.S. West (Northern California) | 1.17 | 1.17 |
| Asia-Pacific (Singapore) | 1.33 | 1.30 |
| Asia-Pacific (Sydney) | 1.15 | 1.15 |
| Canada (Central) | 1.26 | 1.22 |
| Europe (Spain) | -- | 1.11 |
| China (Ningxia) | 1.28 | 1.26 |
Efficiency of scale
Predicting performance
Cooling efficiency
Power efficiency






.jpg)
.jpg)